
Why the U.S. imports silver
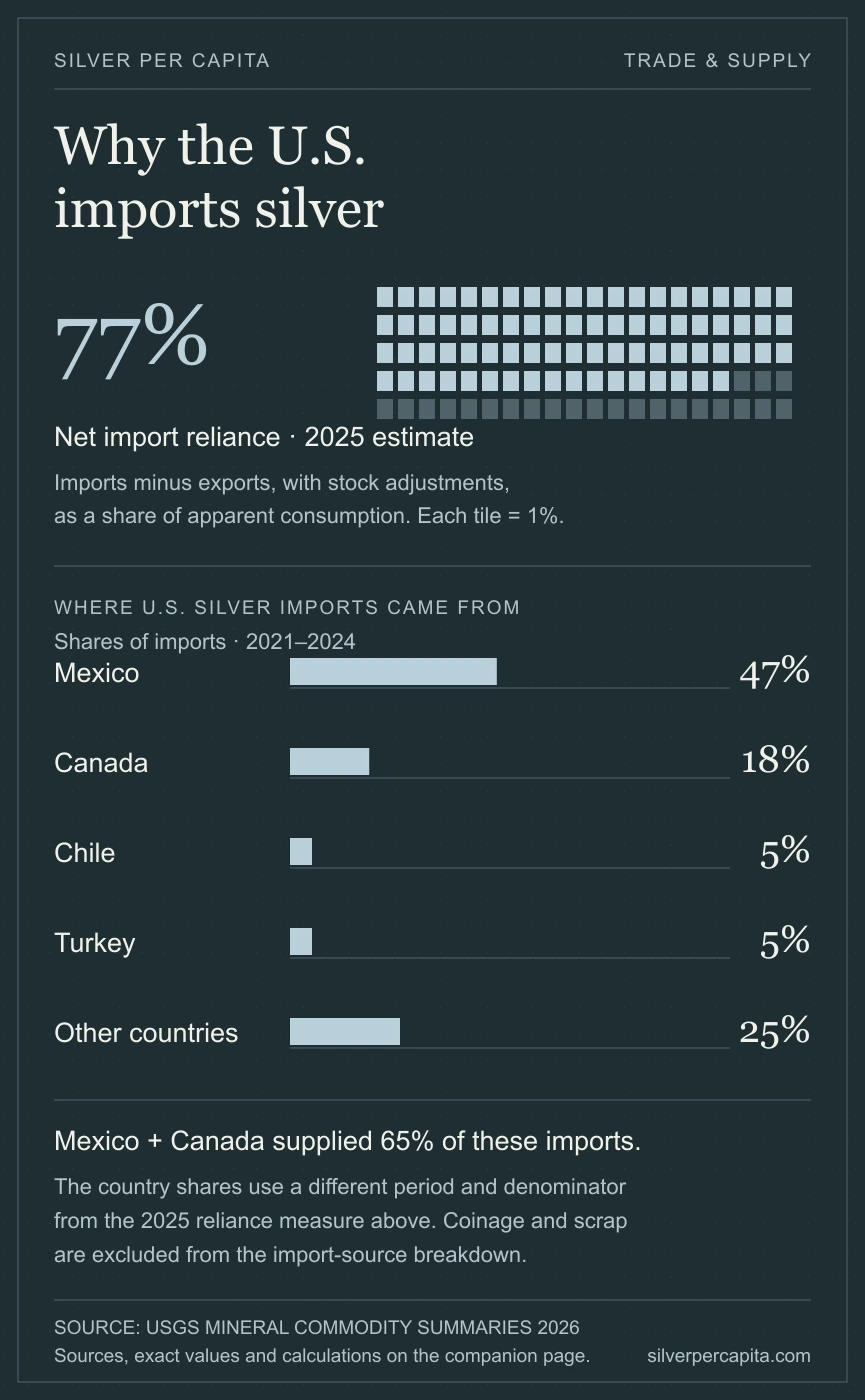
USGS estimates U.S. silver net import reliance at 77% of apparent consumption in 2025. Mexico and Canada supplied 65% of imports in the separate 2021–2024 source breakdown.
Domestic mining and recycling cover only part of use
USGS estimates U.S. mine output at 1,100 metric tonnes and recovery from new and old scrap at 1,000 tonnes in 2025. Apparent consumption was about 9,400 tonnes. Recycling was equivalent to roughly 11% of that measure, while the reported net import reliance estimate was 77%.
Apparent consumption is a supply-based calculation. It combines mine production, secondary production and trade, with adjustments for Government and industry stocks; it excludes investment purchases and sales. It is not a survey of how much silver factories used. The rounded published quantities should not be treated as an exact material balance.
| Year | Share of apparent consumption | Status |
|---|---|---|
| 2021 | 76% | reported |
| 2022 | 67% | reported |
| 2023 | 69% | reported |
| 2024 | 68% | reported |
| 2025 | 77% | estimated |
The supplier story has a different denominator
Mexico and Canada account for 65% of the silver imports in USGS's 2021–2024 breakdown. Those shares describe the origins of imports, not each country's share of all U.S. silver use. They cannot be multiplied by the 2025 reliance percentage to produce a reliable 2025 country allocation.
| Source | Share of covered imports |
|---|---|
| Mexico | 47% |
| Canada | 18% |
| Chile | 5% |
| Turkey | 5% |
| Other countries | 25% |
Silver content of base-metal ores and concentrates, ash and residues, refined bullion and dore; excludes coinage, waste and scrap. Net reliance is a trade-and-stock measure, not a forecast of shortages or prices. For the separately estimated end-use mix, see where America uses silver.
Sources and calculations
Source checks: 22 October 2026. The graphic is drawn from the accompanying values and formulas. Source data retain their own terms; a downloadable image does not change those terms.
- USGS Mineral Commodity Summaries 2026, Silver
PDF page 1: salient statistics and import sources; page 2: footnotes 2, 3 and 7
Silver Per Capita. “Why the U.S. imports silver.” 2026-10-22. https://silverpercapita.com/infographics/us-silver-import-dependence